Saturday, July 19, 2014

AlgeSurf Parametric Equations: Math in 3D - fast, pretty and easy


The Breather Surface. Use your pointing device to pan rotate and zoom

Some of of best friends are mathematicians. This does not mean I necessarily like what they do. On the contrary, I find the Euler-derived notation difficult to parse, not easy to remember and not really pretty to look at. And then, say you have equations printed on a piece of paper or even displayed in Wikipedia - such as the Frobenius Endomorphism. Now tap or swipe the equation with your fingers. Nothing happens! People spend hours formatting text that just so it ends up sitting still like this. How lame is that?

Thank goodness there are alternatives. One of may favorites is computerese. Just translate the equation into Java or Python or JavaScript and now the number of people that can read what is going on increases from thousands to millions.

And another really nice way of displaying math is via the computer display. The display above is generated by the latest update to AlgeSurf - called AlgeSurf PE. PE stands for parametric equations.

The code for the above can be see in breather-surface.html. A much refined and enhanced version is available via the new Equation Browser.

This new display technique represents a major shift in direction from the previously released AlgeSurf Marching Cubes Builder and Player, Both the the Marching Cubes and the Parametric equations apps serve the same purpose: to provide access a extensive libraries of well-known equations and allow you to display, edit and enhance these in 3D.

The Marching Cubes app enables you to do this by accepting and parsing text you enter into an input box - and the text being as close as possible to the standard mathematicians way of writing things. A lot of time and coding went into this effort - with the emphasis being on hiding the code from your view as much as possible.

In other word, the Marching Cube app aids and abets you trying to behave like an old-timey mathematician.

The Parametric Equations app, however, is all about *coding* math. There are 170+ equations - all derived from Jurgen Meier's wonderful web site full of math tutorials written in Java. Each equation is presented as a stand alone HTML file. The files are about 75 lines short and contain everything need to load and view the equation in real-time 3D.

You are very much encouraged to open up any of the files, change the equation and see what happens. It's a fast, fun and easy way to get going with exploring.

The thing is that math can hard and complex and very time-consuming as well. For this you have the Equation Browser. This app reads the the HTML files and adds many features to the display of the equations. Features include the following:

  • Reads, parses and displays remote Three.js HTML files
  • Support real-time 3D pan, rotate and zoom
  • Adds access and editing to full complement of materials, reflections, lights, shade and shadows
  • Update geometry parameters in real-time
  • Display wireframe, face & vertex normals
  • Select background colors or gradients
And the list of future wish list enhancements is even longer.

And as important as the new features might be for helping progress math and math apps, there is perhaps an even more important aspect. JavaScript and Three.js are not APIs or apps but they are languages - coming out of infancy and into broad application.  Both the Marching Cubes and Parametric Equations routines are demonstrations that these tools can have highly diverse and profound mathematical application. And when you click them, stuff happens.

Links:

AlgeSurf PE Equation Browser
AlgeSurf PE Read Me
AlgeSurf PE Source Code

Wednesday, April 30, 2014

Building Borges' Map, One Line of Three.js at a Time

It's been so long since there's been a post, I don't know where to start.

Well, let's look a the map, Good idea! unFlatLand R10 has been up for weeks:


Jaanga unFlatland

But it's what off the map where it has really been happening. The goal - the quest - keeps getting to be bigger, deeper, wider. Soon the map will be - like  Jorge Luis Borges' map -  even bigger than the territory it covers. And, unlike most computer games, the closer we get the easier it gets. Well, that's how it feels at the moment. Tomorrow may bring desolation and sorrow, but not if we can keep on the same course.

So what's the goal?

A little background first. There are many mapping apps out there. Some are more accurate. Some are prettier. Some are faster. But they are still all maps. Things that get you from point A to B and other old-timey mappish things. Map apps are crap apps.

The goal is to take something like a 3D programming language and make cartography simply part of the language. Want people dancing in the streets? You can have it. Blue whales swimming up the Gulf stream? Good to go. Adventures on Route 66? Be my guest. Let your imagination go free.

At the same time, how about a dose of reality? Google maps shows that the distance Union Square in San Francisco to the Fairmont Hotel is just four blocks. What Google Maps does not show you is the 500 foot height difference between the two places. Ditto the Spanish Steps in Rome. Or the Peak to the Star Ferry in Hong Kong. From space the world may be flat, but we cyclists know it isn't that flat

The goal therefore
  • Make 3D terrain data insanely free, quick and easy to obtain
  • Build code examples that even dummies can understand
  • Go places nobody has been to
But what do these things mean?

There are dozens of 2D map overlays available - all following the Tile Map Service standard. All these overlays are available at no charge as long as you are not greedy and you know the tricks. We need to de-trickify access. We need to show: "Here are the URLs that work."

3D data is also available at no charge. But it's imprisoned up in all manner of unusual places and strange ways. We need to unlock this data. We need to put the data up on GitHub and say "Come 'n get it!"

And we need take a popular beginner code page - Three.js - and show that instead of standing on a PlaneGeometry object you could be standing on New Jersey.

So future posts will talk about the 2D data with eighteen or more levels of zoom that is available from dozens of sources.

The 3D data that covers the entire world - land and water - to a reasonable level of accuracy will be described. For the moment that is '30 seconds' data - which is about a data point vey kilometer.

Wherever there is better data, us it. Currently that mean everywhere on the globe where there is land there is a data point every ninety meters.

And in same places such locations on Europe and the US, it is possible to get down to '1 Second data or a data point every 30 meters.

And as always, the coding examples will all be on GitHub. [And always with some broken links and stuff that got out of date before it was finished. ;-]

And, as always, the code will be the code of the designer. If you understand what 'if' and 'for' and '=' can do in JavaScript then you are good to go. No maps needed...


Friday, February 14, 2014

Very Simple Menu r1


The goal of the code and apps on Jaanga is to be a resource for people who know a lot about something and just a little about programming. A hero around here is Mr.doob. He states it bluntly on his Three.js site when he says:
The aim of the project is to create a lightweight 3D library with a very low level of complexity — in other words, for dummies.
We are at one with this mindset.

If you understand the equal sign, an 'if-then' statement and a 'for i = 0 to  i= 100', then reading the code on Jaanga should be quite straightforward.

Also, you do not need too know much about HTML and CSS.  The JavaScript Document Object Model or DOM is built into every browser and the DOM enables you to create and control every aspect of a web page from JavaScript alone. Thus all the Jaanga apps are 100% JavaScript for dummies.

Why try to simplify things?

It's not about simplifying things, it's about simplifying the programming part of things.

You are an architect or physicist or mathematician. Do you also need to be a wiz at jQuery or rule at Ruby?

No, you do not. And, more bluntly, the more time you spend on devising elegant programming code the less time you are spending on your own discipline.

Have a look at the Very Simple Menu demo and source code. Using just these few lines of code you could actually construct a Content Management System (CMS) that could access thousands of files. [And all of these files can even be hosted for you by GitHub free of charge, but that is another matter.]

As simple as this code is, it's worth remembering that this is just Very Simple Menu R1. Could the code be even simpler or the variables have better names? Could the commenting be more explicit?

R2 should be simpler and yet do more. Why not?


Links
Very Simple Menu Demo
Very Simple Menu Source Code


Wednesday, February 5, 2014

Terrain & Terrain Viewer Updates

De Ferranti Gives A Thumb's Up

A large portion of the Jaanga Terrain elevation data originates from Jonathan de Ferranti's Viewfinder Panoramas web site. It is essential therefore to have his approval for the usage and translation of the data.

I emailed Jonathan de Ferranti over the weekend explaining the nature of the Terrain project. He responded quickly saying that the usage of his data in this manner is acceptable. Attribution is requested but not mandatory.

So please do feel free to use the Jaanga Terrain data in any way that you wish. The Jaanga portions of the effort are under an MIT license. And similarly to Jonathan's request: attribution is nice but not required.


Terrain and Terrain Viewer Repositories Now Have Menus

All Jaanga material on the GitHub website is available in two ways. You can view the material as source code at github.com.jaanga/terrain or you can view the material as a web page (using the GitHub Pages feature) at jaanga.github.io.

If you use the latter, there is now a nice and simple menu system that enables you to move around the web pages quickly and easily. There have been a number of previous iterations of of this menu system. This one is the simplest and easiest to maintain/

The goals include
  • Write everything only once
  • Everything that is written automagically appears on both the source code and the web pages
  • Write everything in Markdown format
  • Everything is turned into HTML automagically
There's quite a bit more to the system, but not that much more - or it would start to get complicated which is what we are trying to avoid.

All of this is worth a post or two in its own right, but for the moment just be happy to be able to Roam the repos more easily.

Links


New Repository: Terrain Plus

This repository is for smaller data sets/

The gazetteer with over 2000 places names with latitude and longitude has been moved here

The very beautiful 'unicom' elevation data is now here. More about that data in a later post

Link


PNG Viewer r3: Many New Features

There is now a dropdown that allows you to 'travel' to over 2000 locations.

A 'Lighten' button makes very dark PNG files much easier to read 


The major new new element is that every place in the gazetteer that is withing the current tile area is now displayed on the PNG with a little red box. To the right of the box is displayed the name of the location and its elevation. Not that the elevation is just a height relative the the lowest point in the heightmap. It will take a bit more learning about de Ferranti's data to display the actual elevation. But the data should not be good enough so that an object such as a building can be place on the map and not be up in the air or totally underground.

Now that there is a working prototype, the next step will be to add his feature to unFlatland and start adding objects.

Link


Sunday, February 2, 2014

unFlatland r5.1: New Revision is Up. Already Hopelessly Outdated by unFlatland r6 Dev

unFlatland r6 Dev ~ view of Hong Kong Island 

unFlatland r5.1 is up and it does most everything that was promised in the post on unFlatland r4.

But it sucks.

This revision can now display any location on earth with a height or elevation or altitude or whatever accurate to 90 meters. It accesses the wonderful Jaanga Terrain repository of heightmaps accurate to 90 meters  - anywhere on the entire Earth (Thanks to J de F) . It all follows the OpenStreetMap Tile Map System and zoom from the entire world - zoom level 0 town to zoom level 15 and maybe even beyond

Old School.

It's only five hundred lines of code - so it really is aimed at the target audience (which is us dummies) .

It has geo-referencing. Click the Placards checkbox to to see the city names pop up at the correct latitude and longitude

Yawn.

unFlatland r5 ~ view of San Francisco Bay with 'blobby' overlay

Well, how about this? r5 already has had its first critique. swissGuy says: ' So it remains blobby for the moment.' Obviously swissGuy is taking his own sweet time to observe. Actually unFlatland r5 has *TWELVE* overlays and the blobby overlay is just the one we happened to feature in this release. swissGuy should learn to watch how he watches.

Wotcha!  << London slang greeting

Yes, of course, it should be finished. It must have its FGx aircraft flying around in real-time and, yes, it needs to be Leap Motion-enabled. But...

But what!?!

Well, these other few lines of code just sort of showed up. Kind of by accident. You know, fixing something else in another part of the forest. And there's a bit of crossover in the code. And then, who know how, the code is co-mingled. And thus, yes goddammit, r5 is 'old school'.

OK...

Um, we have decided to name the codeling 'r6'.

Link

unFlatland r6 Dev


unFlatLand 5.1


Friday, January 31, 2014

Jaanga Terrain

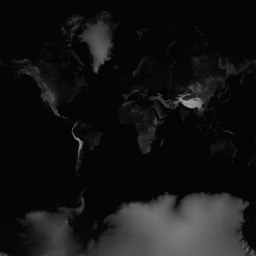
terrain/0/0/0.png - the entire globe at zoom level 0


There is now a new GitHub public repository with heightmaps for the entire globe accurate to 90 meters.

Heightmaps are special image files where every color or shade represents an altitude/height/ elevation. They can help you create 3D cartography quickly and easily.

All of Jonathan de Ferranti's 3 Second data - all 265 gigabytes of raw binary files - have been losslessly compressed down to 2.85 gigabytes of PNG files. The files are organized in  the Open Street Map way - according to the TMS standard.

The files are in the GitHub pages branch so you are free to access these files from your app or use them as you wish. Everything is under an MIT license.

And and as free bonus, Ferranti's 15 Second data is also up and available as well.

All of this is documented and described - including the tricks being used - here;

Jaanga Terrain as GitHub Pages

Jaanga Terrain as GitHub Source Code

There are also links to demo files to show you how JavaScript and libraries such Three.js can be used to view and manipulate the data.

And, if we weren't so busy with all the viewers, we would be working on the One Second data - accurate to about 30 meters.

Thank you Jonathan de Ferranti, GitHub and Mr.doob for making all this possible.


Thursday, January 9, 2014

unFlatland: Make Maps in 3D


The coding has been too much fun and thus the writing of posts has not been good. Even worse: the more I code the more things there are to write about and I fall even further behind. Speaking of Sysiphus my previous post - on FGx Globe - was about rolling that big rock we all live aboard.

The issue with the FGx Globe is that it really only shows the aircraft that are in the air. Well, aircraft do need and want to touch land from time time. Even these virtual ones.

So, what are some ways for you to quickly and easily display highly detailed 3D geography in your browser? Exploring the possibilities has been keeping me up late - and even getting me up early for weeks.

So let's jump back a month or so:

UnFlatland R 4.1

This 3D map covers the entire earth with an accuracy of one elevation point approximately every one kilometre or 43,600 x 43,600 data points.

The current goals include:
  • Attain an accuracy of a datum every one hundred meters for the entire earth.
  • Make the data sufficiently compact that it will fit in a single GitHub repository - which have limits of about one gigabyte of data maximum
  • Follow the TMS/Slippy Map simple proven methods
  • Have it all work in browser with nothing to download or install
  • Make it easy enough so that beginning and intermediate coders can build and edit 3D maps
  • Supply the knowhow so that it is easy to add building, diagramming, 

There's probably another half-dozen cool things involved, but the main thing is to get the code up on GitHub and thus allow you to play with it.

Some comments on unFlatland.
  • Latitude & Longitude. Enter any latitude or longitude and the press 'Go'.
  • Cities dropdown. The 'Cities' dropdown takes you directly to any of 2,017 cities around the world. Macchu Pichu and Kathmandu are fun places to visit.
  • Zoom levels dropdown. Currently there are only zoom-levels 7-12.  Elsewhere we have zoom levels 1-7 working well and progress is being made on the higher levels.
  • Scale: The default is for a highly exaggerated map. Such exaggeration really helps with debugging and identifying issues. Some people say the display looks 'unrealistic'. A setting of one will make the map totally flat. A setting of two approximates true-to-life scale.
  • Map types. Select the type of map you want overlaid or 'draped' over the terrain.
  • Camera controllers. The first person controller allows you to fly over or through the landscape as if you are in a very high-speed helicopter. Pressing the right mouse button or holding two fingers down on the tack pad allows you to fly backwards.
  • Placards. Click the checkbox to toggle the display of the name of every city in the map.
By the way, the title unFlatland has several interesting sources. See the Wikipedia article on Flatland. Also my eldest daughter is an industrial designer. A critical requirement for industrial designers is to be able to think and communicate in 3D. While she was studying, we once had a chat about working with graphic designers and people in the print industry. And she remarked something like "Not interested, all their work is in Flatland."

So the title of this app, unFlatland, is a reminder that we live in a 3D world. We are in the process of leaving behind those old 2D paper maps and entering a world full of lumps and bumps. And even more importantly, it is a land where people live and things happen and our maps should reflect this activity.

You can see two derivatives of unFlatland that begin to show the active possibilities.
FGx Plane Spotter allows you to travel to all the usual places. And you can also see who is currently flying a virtual aircraft using the FlightGear simulator. And if you have a Leap Motion device you can have a hand, so to speak, in the game yourself.


Wednesday, December 11, 2013

FGx Globe R5: New Globe Type, More Aircraft, More Thumbnails


For the past several weeks I have been working on the FGx project. I think FGx stands for Flight Gear Extras. The effort includes the design, style and content of the web pages hosted on GitHub as well as FGx Globe. FGx Aircraft Overview and FGx Airports Runways Navaids.

I have been communicating almost entirely with the other members of the project via the FGx Google Group but realize this is silly because it's *you* I should be talking to. 

All of this work is in need of feedback and comments and suggestions.

The screen grab above is from FGx Globe. It's showing aircraft that are currently being flown by people using the FlightGear flight simulator.  Of course the globe is in 3D and so you can zoom, pan and rotate the globe. Move your mouse over an aircraft and a window pops up with the flight details and a thumbnail image of the plane. Open the Crossfeed tab, click on a flight and a separate window opens showing the aircraft flying over a 2D map. And there's much more; please explore the tabs. The main thing missing in the tabs is the credits and licensing data for all the tools used to build this app, but this info is being added slowly but surely.  

So FGx Globe is in a good enough state - but just for the moment.

Coming up will be fixing the issues with all the aircraft in FGx Aircraft. Some craft are missing, some are missing just a few bits (like wings or propellers ;-), and others have extra bits such as light shields or parachutes. Once that is done, we nee to see if we can reattach all the logos and paint jobs.

Once the planes are in order, we can come back to FGx Globe and decide then next big thing which is what happens when you zoom way in? How do you get to the place where you can see the planes taking off and landing at the airports? Should the next step be inside FGx Globe or should you transition to a different app. I will be looking into both possibilities in upcoming posts.

In the mean time, happy globe-trotting!


Thursday, November 14, 2013

Leap + Three.js: Boilerplate post at Leap Motion Labs


On the 15th of October Leap Motion Labs published a post written by me:

Thinking as a Designer: What’s a Good Leap + Three.js Boilerplate?

From my point of view it's a fairly good post because the contents fulfill many of what I consider to be essential requirements for a good technical post which might include:

  • An assortment of visuals
  • Access to source code easily obtainable on GitHub
  • A YouTube video
  • Plenty of links to useful information
  • And a demo app that works

And, above and beyond the specification items, there's a even fairly lively story.

So how did this post go from the original email request into a published post in about five days?

The answer has little to do with me. The answer may be surprising at first, but then becomes eminently reasonable.

Look at the publisher of the post.

labs.leapmotion.com

And when I say 'look' I mean click on the link and flip through some of the articles.

In my opinion, this site stands out as one of the best online vendor-specific tech journals currently in operation.

The articles are lengthy and yet entertaining, in-depth and yet readable and do a great job of marketing without a heavy sales pitch. I don't think you will find many other start-ups with such a well-worked out formula for disseminating what is actually very complicated stuff.

Why is the Leap Motion Lab doing such a good job when other aspects of the Leap Motion organization are quite lacking? Perhaps, it's the people. The editor I worked with, Alex Colgan, in a matter of hours transformed the job of preparing the article from being a task into being a pleasure. Alex lives/works in Yarmouth, Nova Scotia but the distance in time and miles did little to prevent a speedy and engaged conversation. And the Google Docs real-time collaboration was a blast.

The main thing is that Alex picked up my style of writing ever so quickly. He made a lot of edits and yet looking back at the post I can't tell if a phrase is his or mine - even in the most technical parts. I worked through the weekend to finish the post, but Alex made it easy.

So if anybody at Leap ever asks you to pen a post for the Labs journal, you should immediately place your hands over your Leao device and reply with a thumbs up.


Wednesday, October 9, 2013

Leap + Three.js: Phalanges R7 Video


Description

The goal is to build a web app with the procedures required to display - correctly and in real-time - a user-manipulated 3D hand - or claw - or appendage. This demo shows what is still a work in progress.

Source Code here: https://github.com/jaanga/gestification/tree/gh-pages/cookbook/phalanges

Live demo here: http://jaanga.github.io/gestification/cookbook/phalanges/r7/phalanges.html
- Requires a Leap Motion device

The motion is captured using a Leap Motion device. See http://leapmotion.com

The 3D graphics are generated using the Three.js JavaScript library. See http://threejs.org

The video was recorded using CamStudio. http://http://camstudio.org/ There needs to be work on capturing data at a better frame rate.


Phalanges R7 - Requires Leap Motion Device to operate

Transcript

Hello this is Theo. And You're looking at the new Phalanges Release 7
Phalanges is Latin term for finger bones
It's October 8th 2013,  here in San Francisco
What you're seeing is the movements of my hand recreated in a 3D space
I'm using the Leap Motion device to capture the actual movements of my hand and fingers as I speak
The graphics you see in the video are being generated on screen using the three.js JavaScript library
The issue in all this is that the Leap device cannot see all your fingers all the time
So whenever one of the  colored block disappears, it means that the Leap Device cannot see that finger
The objective of the code is to keep all the fingers  - the gray box-like objects - visible at all times.
The second objective have fingers *not* go off in crazy directions.
As you can see there's a fairly good connection, but it's not perfect.
I can make my hand  pitch - roll  - and Yaw
I can wiggle my fingers
Mostly the fingers the visible and not too crooked
And it's a lot better than Release 1
Anyway, All of this very much a work in progress.
What you are looking at is example or cookbook code.
It's a program intended to be used as the basis for further development
So it's not a thing beauty.
For example, you can see All the dummy objects to make sure the fingers point in the right direction
They are just here for testing and won't be visible in later programs
Speaking of later programs
The next generation of code based on this work will be out very soon'
Two major features will be getting into this code:
First, You will be able to use this these algorithms to save data in the industry-standard BVH file format.
Secondly, you'll be able use this code to display human-like hands, or animal claws or robot appendages or whatever'
So there's a lot more to be coming out out of this code.
But for the moment, this is Theo, saying 'Bye for now...'